Proc Rank :
Compute the ranks for one or more numeric variables in a SAS data set and output the ranks to a new SAS data set.
Proc Rank can’t produce itself display output.
Syntax:-
PROC RANK <OPTIONS>;
BY <DESCENDING> VARIABLE-1 <…<DESCENDING> VARIABLE-N>;
VAR DATASET-VARIABLE<S>;
RANKS NEW-VARIABLE<S>;
RUN;
Options:-
Data=Dataset
Which SAS dataset will be involved in Ranking
Out=Dataset
Name of the SAS dataset which output will be written.
Descending
Compute ranks from highest to lowest values. Default is from lowest to highest.
Fraction
Computes fractional ranks by dividing each rank by the number of observations having nonmissing values of the ranking variable.
Groups=no of groups
Assigns group values ranging from 0 to number-of-groups minus 1. Common specifications are GROUPS=100 for percentiles, GROUPS=10 for deciles, and GROUPS=4 for quartiles.
For example, GROUPS=4 partitions the original values into four groups, with the smallest values receiving, by default, a quartile value of 0 and the largest values receiving a quartile value of 3.
The formula for calculating group values is as follows:FLOOR(rank * k/(n+1))
FLOOR is the FLOOR function, rank is the value’s order rank, k is the value of GROUPS=, and n is the number of observations having nonmissing values of the ranking variable.
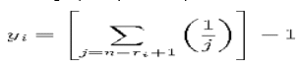
Savage
Computes Savage (or exponential) scores from the ranks by the following formula (Lehman 1998):
Percent
Divides each rank by the number of observations that have nonmissing values of the variable and multiplies the result by 100 to get a percentage.
NORMAL=BLOM | TUKEY | VW
Computes normal scores from the ranks. The resulting variables appear normally distributed. The formulas are as follows:
Bloom yi= -1(ri-3/8)/(n+1/4)
Tukey yi= -1(ri-1/3)/(n+1/3)
VW yi= -1(ri)/(n+1)
In these formulas, -1 is the inverse cumulative normal (PROBIT) function, ri is the rank of the ith observation, and n is the number of nonmissing observations for the ranking variable.
VW stands for van der Waerden. With NORMAL=VW, you can use the scores for a nonparametric location test. All three normal scores are approximations to the exact expected order statistics for the normal distribution (also called normal scores). The BLOM version appears to fit slightly better than the others (Blom 1958; Tukey 1962).
Ties=High | Low | Mean | Dense
Specifies how to compute normal scores or ranks for tied data values.
HIGH assigns the largest of the corresponding ranks (or largest of the normal scores when NORMAL= is specified).
LOW assigns the smallest of the corresponding ranks (or smallest of the normal scores when NORMAL= is specified).
MEAN assigns the mean of the corresponding rank (or mean of the normal scores when NORMAL= is specified).
DENSE computes scores and ranks by treating tied values as a single-order statistic. For the default method, ranks are consecutive integers that begin with the number one and end with the number of unique, non-missing values of the variable that is being ranked. Tied values are assigned the same rank.
Statements:-
Var Statement
Specify the variables to print ranks. Otherwise it prints ranks for all numeric variables.
Ranks Statement
Identify a variable that contains the ranks. Without Ranks statement ranks will replace in original values.
By Statement
Calculate a separate set of ranks for each BY group wise.
Example1:-
Data RNK1;
Input AREA gain;
Datalines;
1 7.2
1 7.9
1 7.6
1 6.3
1 8.4
1 8.1
3 5.5
3 6.7
3 8.9
2 8.1
2 7.3
2 7.7
2 7.7
;
Run;
It creates ranks for all numeric variables from recent created dataset or specify Data=Dataset for which dataset variables you want create ranks. And ranks will replace on original values in output dataset.
Proc Rank; Proc Rank data=RNK1;
Run; Run;
If we won’t use out=dataset system creates datasets like DATA1, DATA2 etc… with rank variables but if we use out=dataset ranks will produce in output dataset not in data1…etc.
Proc Rank data=RNK1 out=RNK2;
Run;
Default Proc rank doesn’t have display output. But to print output use proc print.
Proc rank data=RNK1 out=RNK2;
Proc print data=RNK2;
Title ‘Rankings with in Locations’;
Run;
Specify the variables to print ranks. Otherwise it prints ranks for all numeric variables.
Proc rank data=RNK1 out=RNK2;
Var gain;
Run;
Identify a variable that contains the ranks. Without Ranks statement ranks will replace in original values.
Proc rank data=RNK1 out=RNK2;
Var gain;
Ranks rankgain;
Run;
Above program creates dataset but if you want to print the output write below program
Proc rank data=RNK1 out=RNK2;
Var gain;
Ranks rankgain;
Proc print data=RNK2;
Title ‘Rankings with in Locations’;
Run;
Computes fractional ranks (Fraction)
Proc rank data=Rnk1 out=Rnk2 fraction;
Var gain;
Ranks x;
Proc print noobs;
Run;
Computes ranks from highest to lowest order (Descending)
Proc rank data=Rnk1 out=Rnk2 descending;
Var gain;
Ranks x;
Proc print noobs;
Run;
Partition observations into groups (Groups=no of groups)
Proc rank data=Rnk1 out=Rnk2 groups=4;
Var gain;
Ranks x;
Proc print noobs;
Run;
Computes Savage (or exponential) scores from the ranks (Savage)
Proc rank data=Rnk1 out=Rnk2 savage;
Var gain;
Ranks x;
Proc print noobs;
Run;
Specifies how to compute normal scores or ranks for tied data values (Ties=High | Low | Mean | Dense)
Proc rank data=Rnk1 out=Rnk2 ties=high;
Var gain;
Ranks x;
Proc print noobs;
Run;
Divides each rank by the number of observations that have nonmissing values of the variable and multiplies the result by 100 to get a percentage (Percent)
Proc rank data=Rnk1 out=Rnk2 percent;
Var gain;
Ranks x;
Proc print noobs;
Run;
Computes normal scores from the ranks. The resulting variables appear normally distributed (Normal=Blom | Tukey | VW)
Proc rank data=Rnk1 out=Rnk2 normal=blom;
Var gain;
Ranks x;
Proc print noobs;
Run;
Prints ranks and arranges the values in by variable wise
Proc sort data=rnk1 out=rnk1a;
By area;
Run;
Proc rank data=RNK1a out=RNK2;
Var gain;
Ranks rankgain;
Proc print data=RNK2;
Title ‘Rankings With in Locations’;
Run;
Prints the ranks on each by group wise in grouping variable. Default arranged in ascending order.
Proc sort data=rnk1 out=rnk1a;
By area;
Run;
Proc rank data=RNK1a out=RNK2;
By area;
Var gain;
Ranks rankgain;
Proc print data=RNK2;
Title ‘Rankings With in Locations’;
Run;
Prints the ranks on each by group wise in grouping variable (descending order).
Proc sort data=rnk1 out=rnk1a;
By area;
Run;
Proc rank data=RNK1a out=RNK2 descending;
By area;
Var gain;
Ranks rankgain;
Proc print data=RNK2;
Title ‘Rankings With in Locations’;
Run;
Prints the ranks in separate outputs on each by group in grouping variable
Proc sort data=rnk1 out=rnk1a;
By area;
Run;
Proc rank data=RNK1a out=RNK2;
By area;
Var gain;
Ranks rankgain;
Proc print data=RNK2;
By area;
Title ‘Rankings With in Locations’;
Run;
Example2:-
Data Golf;
Input Player$ Strokes;
Datalines;
Jack 279
Jerry 283
Mike 274
Randy 296
Tito 302
;
Run;
Proc rank data=Golf out=golf2;
Var strokes;
Ranks Finish;
Proc print data=golf2;
Run;
Example3:-
Data Relay;
Input name $ sex $ back breast fly free;
Datalines;
Sue F 35.1 36.7 28.3 36.1
Karen F 34.6 32.6 26.9 26.2
Andrea F 28.6 34.1 29.1 30.3
Carol F 32.9 32.2 26.6 24.0
Ellen F 27.8 32.5 27.8 27.0
Jim M 26.3 27.6 23.5 22.4
Mike M 29.0 24.0 27.9 25.4
Sam M 27.2 33.8 25.2 24.1
Clayton M 27.0 29.2 23.0 21.9
Run;
Proc rank data=Relay out=Fast;
By sex;
Var back breast fly free;
Ranks a b c d;
Run;
Proc print data=Fast label;
Var back a breast b fly c free d;
/*by sex;*/
Run;
How to find Second maximum salary using Proc Rank ?
Data ds1;
Infile datalines;
Input id name$ sal;
Datalines;
101 abc 5000
102 def 6000
103 jkl 7000
104 mno 4000
105 xyz 8000
;
Run;
Proc rank data=ds1 out=ds2 descending;
var sal;
Ranks x;
run;
Data ds3(drop=x);
Set ds2;
if x=2;
Run;
How to find top5 ranks for height using Proc Rank ?
Data ds1;
Set sashelp.class;
Run;
Proc rank data=ds1 out=ds2(where=(x<=5)) descending ;
Var height;
Ranks x;
Run;
How to find dense ranks or average ranks ?
Data ds1;
Set sashelp.class;
Run;
Proc rank data=ds1 out=ds5(where=(x<=5)) descending ties=dense ;
Var height;
Ranks x;
Run;
Proc rank data=ds1 out=ds2(where=(x<=5)) descending ties=low ;
Var height;
Ranks x;
Run;
Proc rank data=ds1 out=ds3(where=(x<=5)) descending ties=high ;
Var height;
Ranks x;
Run;
Proc rank data=ds1 out=ds4(where=(x<=5)) descending ties=mean ;
Var height;
Ranks x;
Run;
