Proc Gchart :
The chart statement is useful to create frequency graphs like
HBAR, HBAR3D, VBAR, VBAR3D, PIE, PIE3D, STAR, BLOCK and DONUT charts.
Syntax:-
Proc Gchart data= dataset;
Chart chart-request(s)/options;
By Variable(s);
Run;
Examples:-
Data ds;
Set sashelp.class;
Run;
HBAR & HBAR3D
Proc Gchart data=ds;
Hbar sex;
Run;
Quit;
Proc Gchart data=ds;
Hbar sex age;
Run;
Proc Gchart data=ds;
Hbar3d age;
Run;
Quit;
Proc Gchart data=ds;
Hbar3d age /nostats;
Run;
Quit;
Proc sort data=ds;
By sex;
Run;
Quit;
NOSTAT – Suppress printing of statistics in Hbar/Hbar3d.
Proc Gchart data=ds;
Hbar3d age /nostats;
By sex;
Run;
Quit;
VBAR & VBAR3D
Proc Gchart data=ds;
Vbar age;
Run;
Quit;
Proc Gchart data=ds;
Vbar3d age;
Run;
Quit;
VBAR & VBAR3D
Proc Gchart data=ds;
Vbar age;
Run;
Quit;
Proc Gchart data=ds;
Vbar3d age;
Run;
Quit;
Options for HBAR and VBAR Charts
MIDPOINTS= – specifies values for the midpoint values on the midpoint axis.
Proc Gchart data=ds;
Vbar3d age/midpoints=11 12 13 14 15 16;
Run;
Quit;
CAXIS – Applies colors for axis (borders).
Proc Gchart data=ds;
Vbar3d age/caxis=red;
Run;
Quit;
CFRAME – Applies colors for frame.
Proc Gchart data=ds;
Vbar3d age/caxis=red cframe=green;
Run;
Quit;
CTEXT – Applies colors for text.
Proc Gchart data=ds;
Vbar3d age/caxis=red cframe=green ctext=blue;
Run;
Quit;
SPACE – Increase/decrease space between bars.
Proc Gchart data=ds;
Vbar3d age/caxis=red cframe=green ctext=blue space=10;
Run;
Quit;
WIDTH – Increase/decrease width of Bars.
Proc Gchart data=ds;
Vbar3d age/caxis=red cframe=green ctext=blue width=10;
Run;
Quit;
WOUTLINE – Increase/decrease width of bars outline.
Proc Gchart data=ds;
Vbar3d age/caxis=red cframe=green ctext=blue width=10 woutline=3;
Run;
Quit;
GROUP – Prints graph on each group wise.
Proc Gchart data=ds;
Vbar3d age/caxis=red cframe=green ctext=blue space=5 group=sex;
Run;
Quit;
The same thing we can do with BY statement also.
But difference is no need to sort data for GROUP, need to sort data for BY Statement.
GROUP print one Bar for all groups, but BY statement prints each group separate bar.
Proc Gchart data=ds;
Vbar3d age/caxis=red cframe=green ctext=blue space=5;
By sex;
Run;
Quit;
SUBGROUP – Each bar in chart can be subdivided into segments.
Proc Gchart data=ds;
Vbar3d age/caxis=red cframe=green ctext=blue space=5 subgroup=sex;
Run;
Quit;
When this option is used SAS/GRAPH produces a legend automatically. To suppress the legend specify the option NOLEGEND in the HBAR or VBAR statements.
Proc Gchart data=ds;
Vbar3d age/caxis=red cframe=green ctext=blue space=5 subgroup=sex nolegend;
Run;
Quit;
LEGEND Global statement and the LEGEND= Option
SAS/GRAPH automatically produces a legend when the SUBGROUP= option is used in the HBAR, HBAR3D, VBAR or the VBAR3D statement. However, if you would like to make any modifications to the default attributes of the legend it is necessary to use both a LEGEND statement and the LEGEND= option. The NOLEGEND option suppresses the legend.
Syntax: – Legend options;
LABEL= (text_description) or NONE
VALUE= (text_description) or NONE
ACROSS=n where n is the number of entries in each row of the legend
POSITION=(y x z) where y is either BOTTOM, MIDDLE or TOP, x is either LEFT,
CENTER or RIGHT, and, z is either OUTSIDE or INSIDE
FRAME draws a frame around the legend
CFRAME specifies a color for the legend’s background
CBORDER specifies a color for the legend’s border
CSHADOW draws and colors a shadow behind the legend
CBLOCK draws and colors a block behind the legend
Legend1 position= (top inside) cborder=magenta;
Proc Gchart data=ds;
Vbar3d age/caxis=red cframe=green ctext=blue subgroup=sex legend=legend1;
Run;
Quit;
Legend1 Label=(position=top ‘Student data’)
Value=(‘Females’ ‘Males’)
Position=(bottom right inside)
Across=1;
Proc Gchart data=ds;
Vbar3d age/caxis=red cframe=green ctext=blue subgroup=sex legend=legend1;
Run;
Quit;
SUMVAR – Specifies the variable to be used for sum and mean calculations
Proc Gchart data=ds;
Vbar3d age/caxis=red cframe=green ctext=blue space=5 subgroup=sex sumvar=height;
Run;
Quit;
Mean – displays the value of the mean statistic.
Proc Gchart data=ds;
Vbar3d age/caxis=red cframe=green ctext=blue
Midpoints=11 12 13 14 15 16 sumvar=height mean;
Run;
Quit;
Freq – displays the value of the frequency statistic
Proc Gchart data=ds;
Vbar3d age/caxis=red cframe=yellow ctext=blue
Midpoints=11 12 13 14 15 16 sumvar=height freq;
Run;
Quit;
Sum – displays the value of the sum statistic
Proc Gchart data=ds;
Vbar3d age/caxis=red cframe=yellow ctext=blue
Midpoints=11 12 13 14 15 16 sumvar=height sum;
Run;
Quit;
IFRAME – Specifies image location to apply image as a frame for graph.
Proc Gchart data=ds;
Vbar3d age/iframe=”C:\Documents and Settings\All Users\Documents\My Pictures\Sample Pictures\water lilies.jpg”;
Run;
Quit;
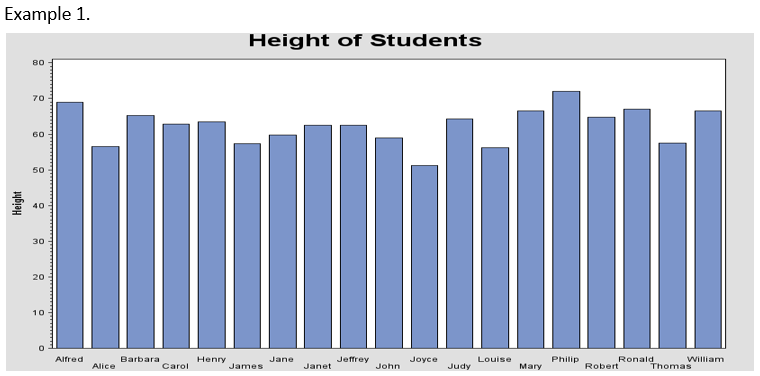
Code
Title ‘Height of Students’;
Axis1 stagger label=none;
Axis2 label=(a=90 ‘Height’);
/* Create space at the bottom of the graph */
Footnote h=.01 in ‘ ‘;
Proc Gchart data=sashelp.class;
Vbar name / sumvar=height maxis=axis1 raxis=axis2;
Run;
Quit;
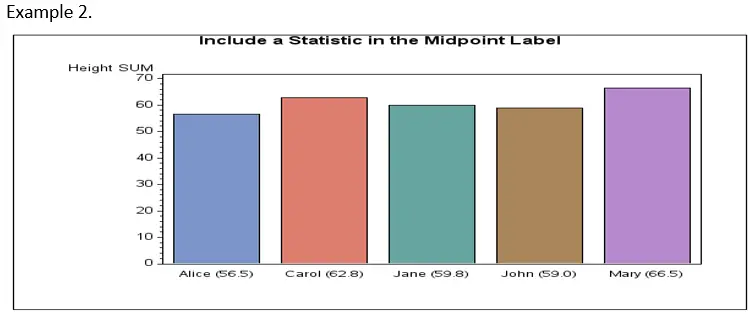
Code
/* Set the graphics environment */
goptions reset=all border cback=white htext=10pt htitle=12pt;
/* Create the annotate data set */
Data ds;
Length function color $8 style $12;
Retain function ‘label’ when ‘a’ size 1 position ‘8’
color ‘black’ xsys ‘2’ ysys ‘1’ style ‘Albany AMT’;
Set sashelp.class;
Where name in(“Alice” “Carol” “Jane” “John” “Mary”);
midpoint=name;
y=0;
text=trim(put(name,5.))||” “||”(“||put(height,4.1)||”)”;
Run;
/* Add a title to the graph */
Title ‘Include a Statistic in the Midpoint Label’;
/* Define a blank FOOTNOTE statement to add space beneath the graph */
Footnote h=2 ‘ ‘;
/* Suppress the midpoint axis values and label */
axis1 value=none label=none;
/* Produce the bar chart */
Proc Gchart data=sashelp.class;
where name in(“Alice” “Carol” “Jane” “John” “Mary”);
Vbar name / sumvar=height annotate=ds patternid=midpoint width=10 maxis=axis1;
Run;
Quit;
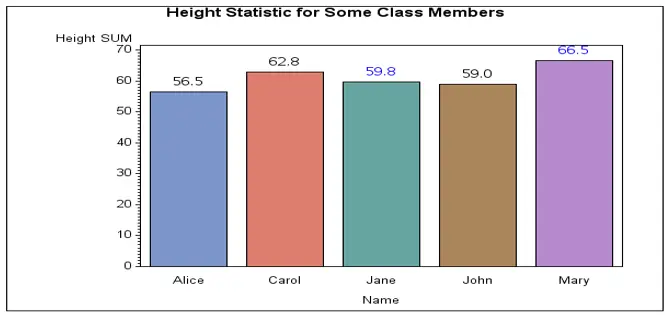
Code
/* Set the graphics environment */
goptions reset=all border cback=white htext=10pt htitle=12pt;
/* Create the Annotate data set*/
Data ds;
Length function color $8 style $12;
Retain function ‘label’ when ‘a’ size 1.25 position ‘2’
color ‘black’ xsys ‘2’ ysys ‘2’ style ‘Albany AMT’;
Set sashelp.class;
Where name in(“Alice” “Carol” “Jane” “John” “Mary”);
If name in(‘Jane’ ‘Mary’) then color=’blue’;
Else color=’black’;
Midpoint=name;
y=height;
Text=put(height,4.1);
Run;
/* Add a title to the graph */
Title ‘Height Statistic for Some Class Members‘;
/* Produce the bar chart */
Proc Gchart data=sashelp.class;
Where name in(“Alice” “Carol” “Jane” “John” “Mary”);
Vbar name / sumvar=height annotate=ds patternid=midpoint width=10;
Run;
Quit;
PIE & PIE3D
Proc Gchart data=Temp;
Pie tempc;
Run;
Quit;
Proc Gchart data=Temp;
Pie3d tempc;
Run;
Quit;
DONUT
Proc Gchart data=Temp;
Donut tempc;
Run;
Quit;
STAR
Proc Gchart data=Temp;
Star tempc ;
Run;
Quit;
Options are for PIE, DONUT & STAR Charts
Proc Gchart data=Temp;
Star tempc / cfill=pink;
Run;
Quit;
Proc Gchart data=Temp;
Star tempc / cfill=pink fill=x;
Run;
Quit;
Proc Gchart data=Temp;
Star tempc / cfill=pink fill=solid;
Run;
Quit;
BLOCK
Proc Gchart data=Temp;
Block tempc;
Run;
Quit;
Proc Gchart data=Temp;
Block tempc/description=’This is Block chart’
Name=’block graph’;
Run;
Quit;
Legend1 cborder=white;
Proc Gchart data=ds ;
Block age/subgroup=sex
Legend=legend1;
Run;
Proc Gchart data=ds ;
Block age/subgroup=sex
Legend=legend1
Midpoints= 11 12 13 14 15 1 17 18 19 20;
Run;
Proc Gchart data=ds ;
Block age/subgroup=sex
Legend=legend1
Midpoints=11 13 15 17 ;
Run;
Legend1 cborder=white Position=(bottom inside);
Proc Gchart data=ds ;
Block age/subgroup=sex Legend=legend1 Midpoints=11 13 15 17 ;
Run;
Legend1 cborder=white Position=(bottom outside);
Proc Gchart data=ds;
Block age/subgroup=sex Legend=legend1 Midpoints=11 13 15 17;
Run;
Legend1 cborder=red Position=(bottom outside);
Proc Gchart data=ds ;
Format age roman.;
Block sex/subgroup=age Legend=legend1 Midpoints=11 13 15 17 ;
Run;
Legend1 cborder=red Position=(bottom outside);
Proc Gchart data=ds ;
Format age roman.;
Block sex/subgroup=age Legend=legend1 Midpoints=11 13 15 17 Noheading;
Run;
All Mixing in one program
Proc Gchart data=Temp;
Hbar Variable/<options;
Vbar Variable/<options;
Pie Variable/<options;
Donut Variable/<options;
Block Variable/<options;
Star Variable/<options;
Run;