Proc Tabulate :
This procedures print out descriptive simple statistics for numeric variables in a table, each table value is displayed in cell controlled by row and columns.
Syntax:-
Proc Tabulate<options>;
Class variable list;
Var analysis variable list;
By variable list;
Keylabel key=newname
Classlev Variable<s>/<options>
Table table specifications/<table options>;
Class statement
Identifies class variables for the table. Class variables determine the categories that PROC TABULATE uses to calculate statistics.
Var statement
Identifies analysis variables for the table. Analysis variables contain values for which you want to compute statistics.
By statement
Identifies By variables for the table. By variables determine the groups that PROC TABULATE uses to calculate statistics on each By group into separate output.
Table statement
Defines the table that you want PROC TABULATE to produce. You must specify at least one TABLE statement. In the TABLE statement you specify page-expressions, row-expressions, and column-expressions.
Keylabel statement
Useful to apply labels for statistical keywords.
Statistical keywords are RANGE CSS SKEWNESS CV STDDEV KURTOSIS LCLM SUM MAX MEAN MIN USS N VAR NMISS
Label statement
Applies labels for existing variables.
Classlev statement
Applies styles for classification levels in class variables.
Examples:-
Data project;
Infile datalines;
Input employee$ week$9. phase$ hours;
Datalines;
Chen 11SEP2010 Analysis 8
Chen 11SEP2010 Analysis 7
Chen 11SEP2010 Coding 2.5
Chen 11SEP2010 Testing 8
Chen 11SEP2010 Coding 8.5
Chen 11SEP2010 Testing 6
Chen 11SEP2010 Coding .
Stewart 11SEP2010 Coding 8
Stewart 11SEP2010 Testing 4.5
Stewart 11SEP2010 Coding 4.5
Stewart 11SEP2010 Coding 10.5
Stewart 11SEP2010 Testing 10
;
Run;
Proc Tabulate;
Class employee week phase;
Var hours;
Table sum*hours;
Title ‘Summary of Hours’;
Run;
Options:-
Data= Dataset
Specify the input data set, Otherwise system consider recent created dataset.
Proc Tabulate Data=project;
Class employee week phase;
Var hours;
Table sum*hours;
Title ‘Summary of Hours’;
Run;
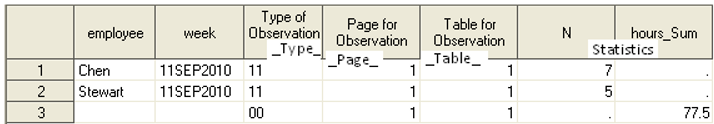
Out= Dataset
Specify the output data set
The number of observations in the output data set depends on the number of categories of data that are used in the tables and the number of subtables that are generated. The output data set contains these variables (in this order):
By variables
Variables that are listed in the BY statement.
Class variables
Variables that are listed in the CLASS statement.
_TYPE_
A character variable that shows which combination of class variables produced the summary statistics in that observation. Each position in _TYPE_ represents one variable in the CLASS statement. If that variable is in the category that produced the statistic, then the position contains a 1; if it is not, then the position contains a 0. In simple PROC TABULATE steps that do not use the universal class variable ALL, all values of _TYPE_ contain only 1s because the only categories that are being considered involve all class variables. If you use the variable ALL, then your tables will contain data for categories that do not include all the class variables, and positions of _TYPE_ will, therefore, include both 1s and 0s.
_PAGE_
The logical page that contains the observation.
_TABLE_
The number of the table that contains the observation.
Statistics
Statistics that are calculated for each observation in the data set.
Proc Tabulate Data= project Out=Project2;
Class employee week phase;
Var hours;
Table employee*week sum*hours;
Title ‘Summary of Hours’;
Run;
Proc Tabulate Data= project Out=Project2;
Class employee week phase;
Var hours;
Table employee*hours week*hours;
Title ‘Summary of Hours’;
Run;
Proc Tabulate Data= project Out=Project2;
Class employee week phase;
Var hours;
Table employee*hours week*hours phase*hours;
Title ‘Summary of Hours’;
Run;
Proc Tabulate Data= project Out=Project2;
Class employee week phase;
Var hours;
Table employee= ’employee’ week*hours;
Title ‘Summary of Hours’;
Run;
Noseps
Eliminates horizontal separator lines from row titles and body of the printed table.
Proc Tabulate Data= project Format=8.2 noseps;
Class employee week phase;
Var hours;
Table week, employee all, sum*hours=’ ‘*(phase all);
Table week, employee all, pctsum*hours=’ ‘*(phase all);
Keylabel sum=’Total Hours’
Pctsum=’Percentage of Hours’;
Title ‘Summary of Hours’;
Run;
Format=
Specify a format for each cell in the table
Proc Tabulate Data= project Format=8.1;
Class employee week phase;
Var hours;
Table week, employee all, sum*hours=’ ‘*(phase all);
Table week, employee all, pctsum*hours=’ ‘*(phase all);
Keylabel sum=’Total Hours’
Pctsum=’Percentage of Hours’;
Title ‘Summary of Hours’;
Run;
Proc Tabulate Data= project Format=8.1;
Class employee week phase;
Var hours;
Table week, employee all, sum*hours=’ ‘*(phase all);
Table week, employee all, pctsum*hours=’ ‘*(phase all);
Table week, employee all, n*hours=’ ‘*(phase all);
Table week, employee all, nmiss*hours=’ ‘*(phase all);
Table week, employee all, range*hours=’ ‘*(phase all);
Table week, employee all, stddev*hours=’ ‘*(phase all);
Table week, employee all, css*hours=’ ‘*(phase all);
Table week, employee all, skewness*hours=’ ‘*(phase all);
Table week, employee all, max*hours=’ ‘*(phase all);
Table week, employee all, min*hours=’ ‘*(phase all);
Table week, employee all, kurtosis*hours=’ ‘*(phase all);
Table week, employee all, lclm*hours=’ ‘*(phase all);
Table week, employee all, uss*hours=’ ‘*(phase all);
Table week, employee all, var*hours=’ ‘*(phase all);
Title ‘Summary of Hours’;
Run;
Missing
Considers missing values as valid values to create the combinations of class variables.
Special missing values that are used to represent numeric values (The letters A through Z and the underscore (_) character) are each considered as a separate value. A heading for each missing value appears in the table.
If you omit MISSING, then PROC TABULATE does not include observations with a missing value for any class variable in the report
Proc Tabulate Data= project Format=8.2 noseps missing;
Class employee week phase;
Var hours;
Table week, employee all, sum*hours=’ ‘*(phase all);
Table week, employee all, pctsum*hours=’ ‘*(phase all);
Keylabel sum=’Total Hours’
Pctsum=’Percentage of Hours’;
Title ‘Summary of Hours’;
Run;